In many ways, the global markets are in
uncharted waters with no clearly defined swim lanes. These extremes are
forcing many investors to face uncomfortable questions (e.g. what discount rate
should I use in my discounted cash flow analysis?) and feel pressure to
compromise their valuation assumptions and discipline in order to find
investible stocks.
Our predictions are no better than
yours, but holding a little extra dry powder in such abnormal times provides
some comfort and optionality for opportunistic buying if the future surprises
to the downside. Swim carefully, my friends.
Global
stock markets are generally at or near all-time highs:
The S&P 500 is at an all-time high:

Japan’s Nikkei 225 index has gained
more than 25% over the past year to approach a 15-year high:

The FTSE 100 index is also at an
all-time high:

Global
bond yields are near all-time lows:
In the US, the 10-year treasury yield
has drifted down from 3% in early 2014 to 2%:

Turning to Japan, we see a similar
story:

In Germany, the 10-year treasury yield
is at a 5+ year low:

Finally, Switzerland’s 10-year yield
actually dipped into negative territory earlier this year and sits just above
0% today:

Lower rates around the world are
forcing many income-seeking investors to chase yield in riskier, less familiar
markets. For example, according to a recent Wall Street Journal
article,
junk-rated companies have raised over $20B of bonds so far in 2015, more than
double the amount in the same period last year.
The knock-on effects are highly
uncertain but are (at least temporarily) helping riskier firms raise financing
with ease. Do European high-yield bonds really offer value? Only time will
tell.
Commodities
are tumbling: Bloomberg’s commodity
index tracks 22 raw materials and has now declined for four straight years to
sit at a 5-year low.

FX volatility
is increasing: the US dollar has
strengthened significantly since the summer of 2014 and sits near a 5-year low.
The chart below shows the EUR to USD
exchange rate. The rate plummeted to over a 10-year low as the market digested
news that the European Central Bank will introduce a $1.23 trillion stimulus
plan.

Meanwhile, Japan’s yen has declined
more than a third against the US dollar since Japanese Prime Minister Shinzo
Abe took office in December 2012 and began implementation of monetary and
fiscal stimulus. The chart below shows the impact on the yen to USD exchange
rate:

Global
central bank interest rate cuts and stimulus are at unprecedented levels:
Central banks around the world are
playing “currency roulette.” According to Bloomberg, 19 of the 53 central banks
it tracks have dropped their benchmark interest rates in the past three months
– “Low rates encourage consumers to borrow and spend, increasing domestic
consumption. They also devalue currencies, making exports cheaper. That’s good
for the countries selling but hard on countries flooded with cheap products.”

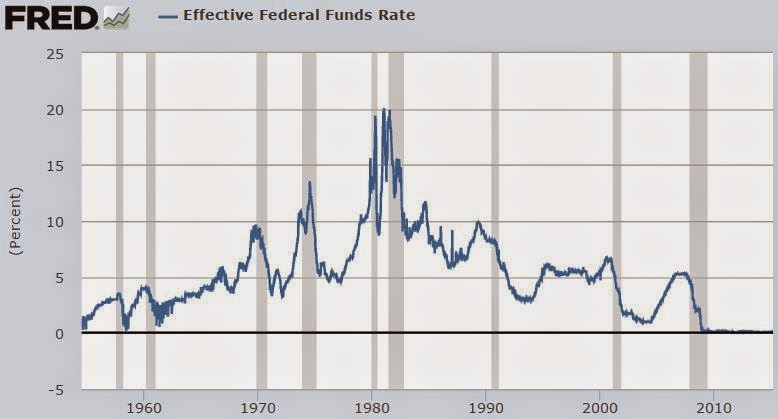
In the US, the federal funds rate
(below) is the interest rate at which a bank lends funds maintained at the
Federal Reserve to another bank overnight. The higher the rate, the more
expensive it is to borrow money. Since it is only applicable to very
creditworthy institutions for extremely short-term (overnight) loans, the rate
can be viewed as the base rate that determines the level of all other interest
rates in the U.S. economy. As seen below, the Fed has maintained an interest
rate of approximately 0% for the last five years, the lowest rate in over 50
years.
Switzerland provides a final example of
the extreme interest rate levels maintained by many central banks. In January
2015, Switzerland stunned global financial markets by slashing its official
interest rate to -0.75% and foregoing its attempts to cap the franc’s exchange
rate against the euro. No central bank has ever
set its official interest so low.
In addition to rate cuts, central banks
have engaged in extreme bond-buying. The Wall Street Journal provided the
following chart:

While the US ended its bond-buying
program in October 2014 (it started in November 2008), the European Central
Bank is just getting started. Starting in March 2015, the European Central Bank
will buy $68 billion of government and corporate bonds each month at least
through September 2016 (a €1tn round of quantitative easing), designed to make
loans and exports cheaper so companies can hire and expand.
Japan’s most recent quantitative easing
program began in April 2013 with plans to unleash a massive program worth $1.4
trillion. Under the plan, the Bank of Japan vowed to buy $70 billion of
government bonds each month using electronically created money. In October
2014, with inflation worryingly low and consumer spending floundering, the Bank
of Japan revealed plans to increase its buying from ¥60-70 trillion a year
previously to ¥80.
The jury is still out on the
effectiveness and knock-on effects of quantitative easing, but here is a
3-minute article by the Economist about quantitative easing: link.
Global
debt-to-GDP has skyrocketed:
According to a report by McKinsey, total debt worldwide
(includes government, corporate, bank, and household debt) has risen by $57
trillion since the end of 2007, representing 286% of global economic output in
2014 compared to 269% in 2007.

The Telegraph provides a longer-term ratio of
global debt (measured differently than McKinsey) to GDP:

Source: The Telegraph
What now?
We have witnessed six years of mostly coordinated global monetary
stimulus. What happens if / when major countries run out of monetary ammunition
before global economies and inflation expectations improve? How will the exit
from global stimulus play out? What happens to government debt payments if
interest rates rise? Will inflation or deflation be unleashed? We do not know,
but we are certainly living in interesting times that will one day make for a
great case study, good or bad.
No comments:
Post a Comment